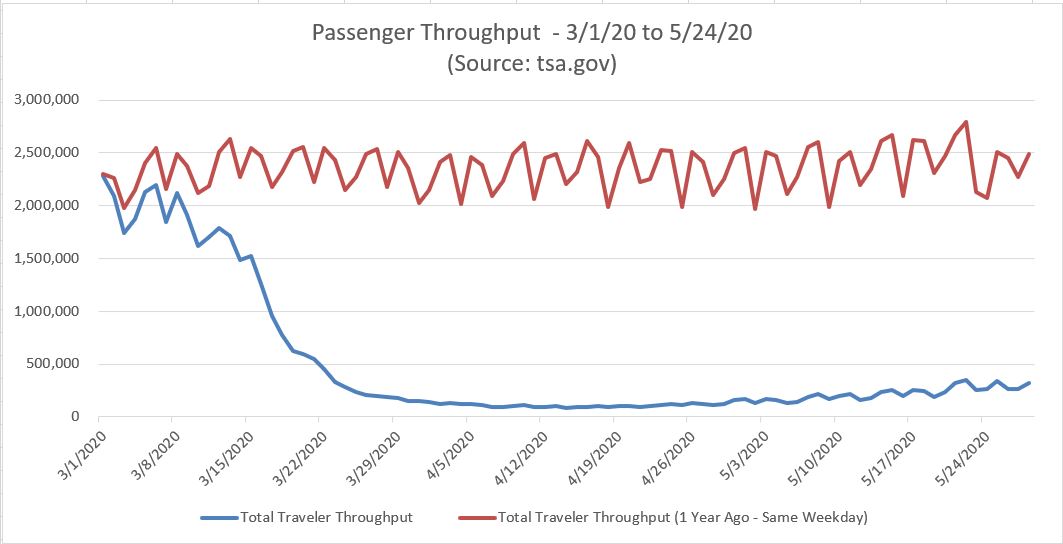
I don’t know if you’ve heard, but there’s a virus going around. Worse still (for this idea), relatively no one is flying in planes as a result. The graph below shows the year-over-year decline in daily passenger throughput in the US, reported by tsa.gov.
With all that said, I have a new idea. An aerospace supplier, recently renamed as Park Aerospace (f/k/a Park Electrochemical – PKE).
Elevator Pitch Investment Thesis
- liquid in a highly distressed industry (commercial aerospace suppliers)
- Growing 25%+ year for each of the last 3 years (pre-COVID – the future will likely be less rosey in the near-term)
- Displaying operating leverage
- Historical capital allocation suggests the company should do well
- CEO is a straight-shooter that doesn’t whitewash missed expectations
- Prior shareholder communications suggest PKE could surprise with an accretive transaction in this environment
After a little background on the company and management, I’ll address the qualitative aspects of the thesis and how I view the value of the company. It’s important to remember that the future of the commercial aerospace industry is uncertain at the moment. While I think the downside is generally protected, it’s still 2020 and anything can happen.
Company History and Description
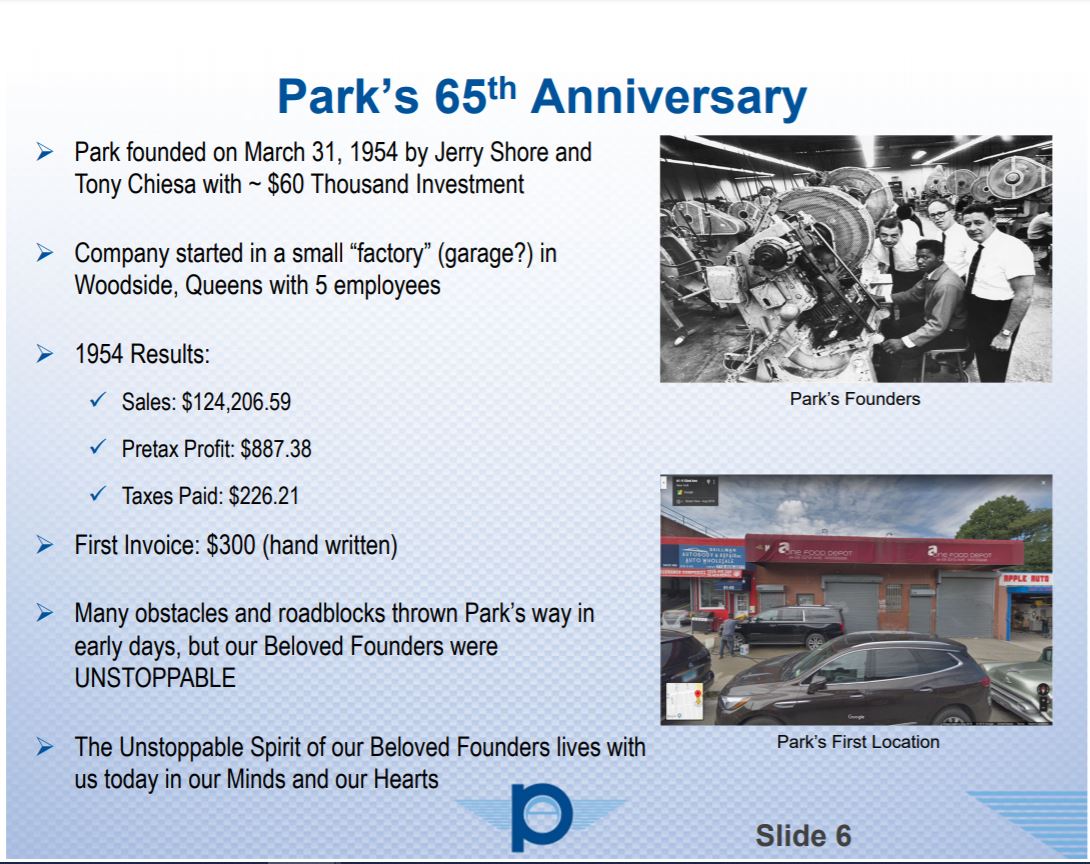
PKE was founded by Jerry Shore and Tony Chiesa on March 31, 1954. The company started its operations with five employees in a small factory in Queens, NY. During the first year of operations, PKE had revenue of $124,206.59 and net income of $621.17.
*Since FY 2005, PKE has paid $536 million in cumulative dividends.
Today, PKE’s CEO is Brian Shore, Jerry’s son. You might not be surprised to learn that the company has since moved manufacturing away from Queens. The company’s administrative offices are in Melville, NY and its manufacturing facilities and warehouses are situated in Newton, KS and Singapore.
In 2018, PKE agreed to sell its circuit board business (Nelco Products) for $145 million, or approximately 14x EBITDA (FY 2018). The circuit board business had been in decline and the company wanted to focus its operations on the fast growing and highly profitable aerospace component segment.
In mid-2019, the company broke ground on an expansion of the Newton manufacturing facility, which is now roughly 88,000 sq ft (2x the previous size). The Newton plant was originally leased in 2008, when PKE first entered the aerospace component business. The facility expansion cost $20.5 million and is likely completed or near-completion, as of writing. The facility should be fully operational by the end of FY 2021.
The facility was expanded per its 13-year, long-term fixed price agreement with Middle River Aerostructure Systems (MRAS), formerly a GE-subsidiary, that is now with ST Engineering (“ST LTA”). It will be discussed more below, but the ST LTA runs through 2029.
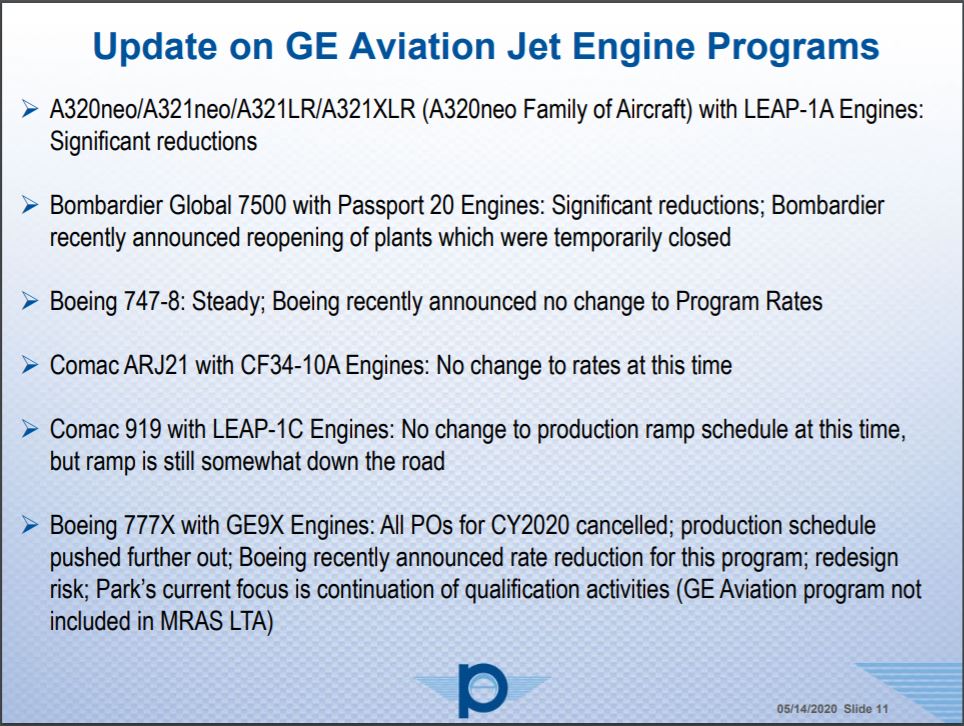
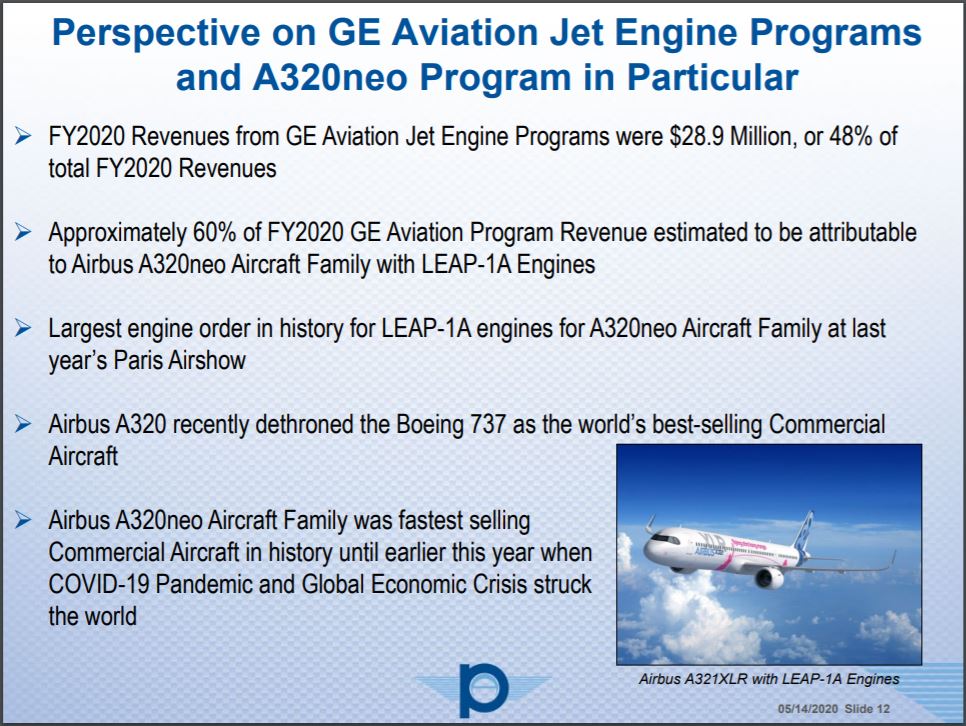
As of writing, PKE has one segment, aerospace components. The company manufactures sole source composite materials for engine nacelles, thrust reversers, and interior fixed structures. The company generally provides parts for aircraft with GE engines. Below is a few slides from PKE’s latest presentation that discuss these programs.
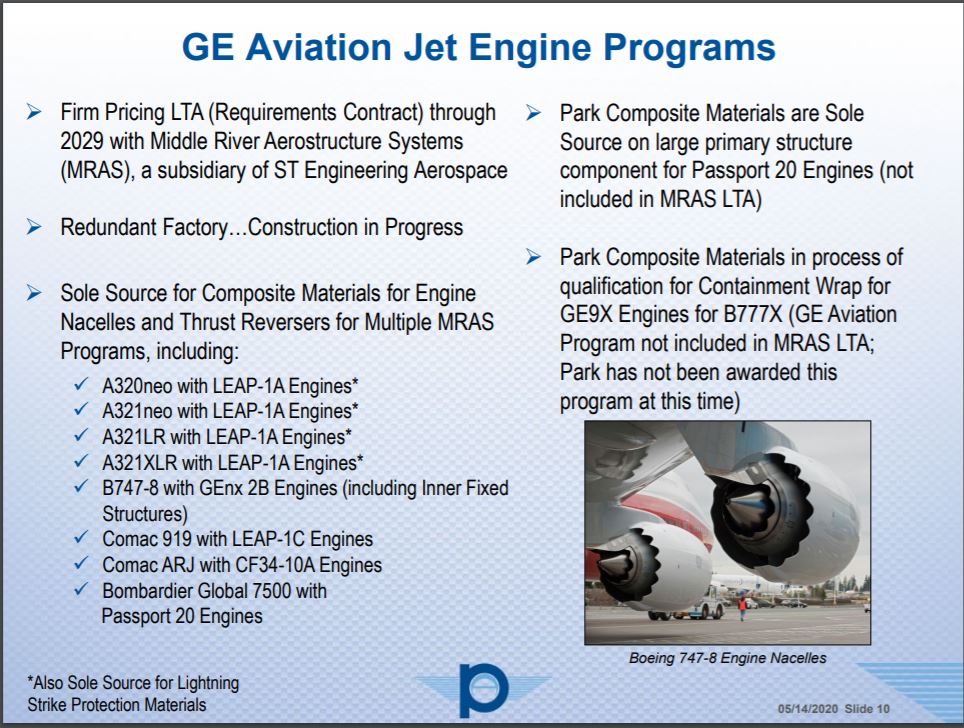
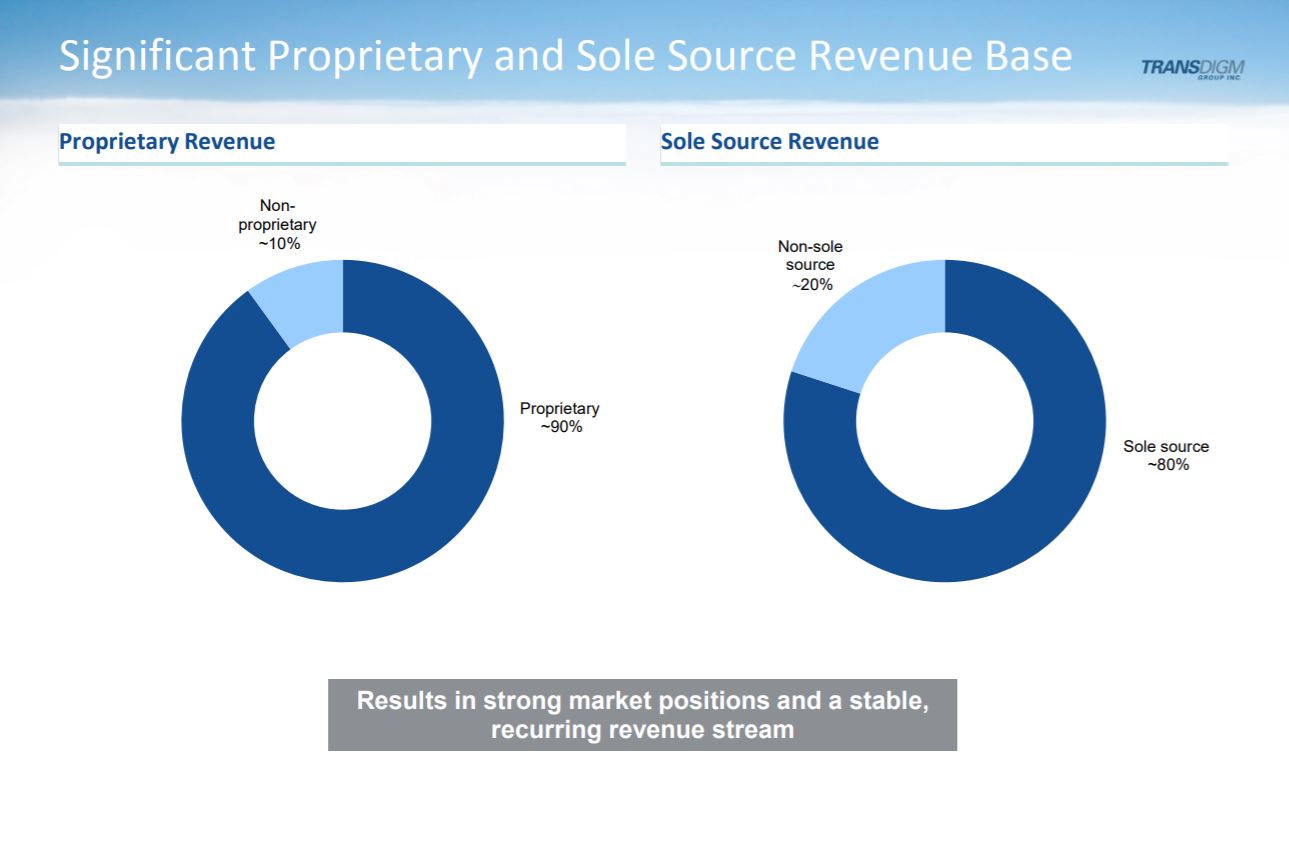
The natural response when looking at aerospace companies is “That’s great, but what percentage of revenue is aftermarket?” What is truly important is the percentage of critical, sole source revenue. While PKE doesn’t provide that exact figure (safe to say they are not as good at promotion as Transdigm (TDG)), we can see that a number of composite materials and structural components are sole source and that many new products, including adhesives, have a fair chance of being awarded similar contracts.
Back in 2017, TDG posted two slides in an investor roadshow that succinctly explained their excess return proposition to shareholders. I think the same elements are present with PKE.
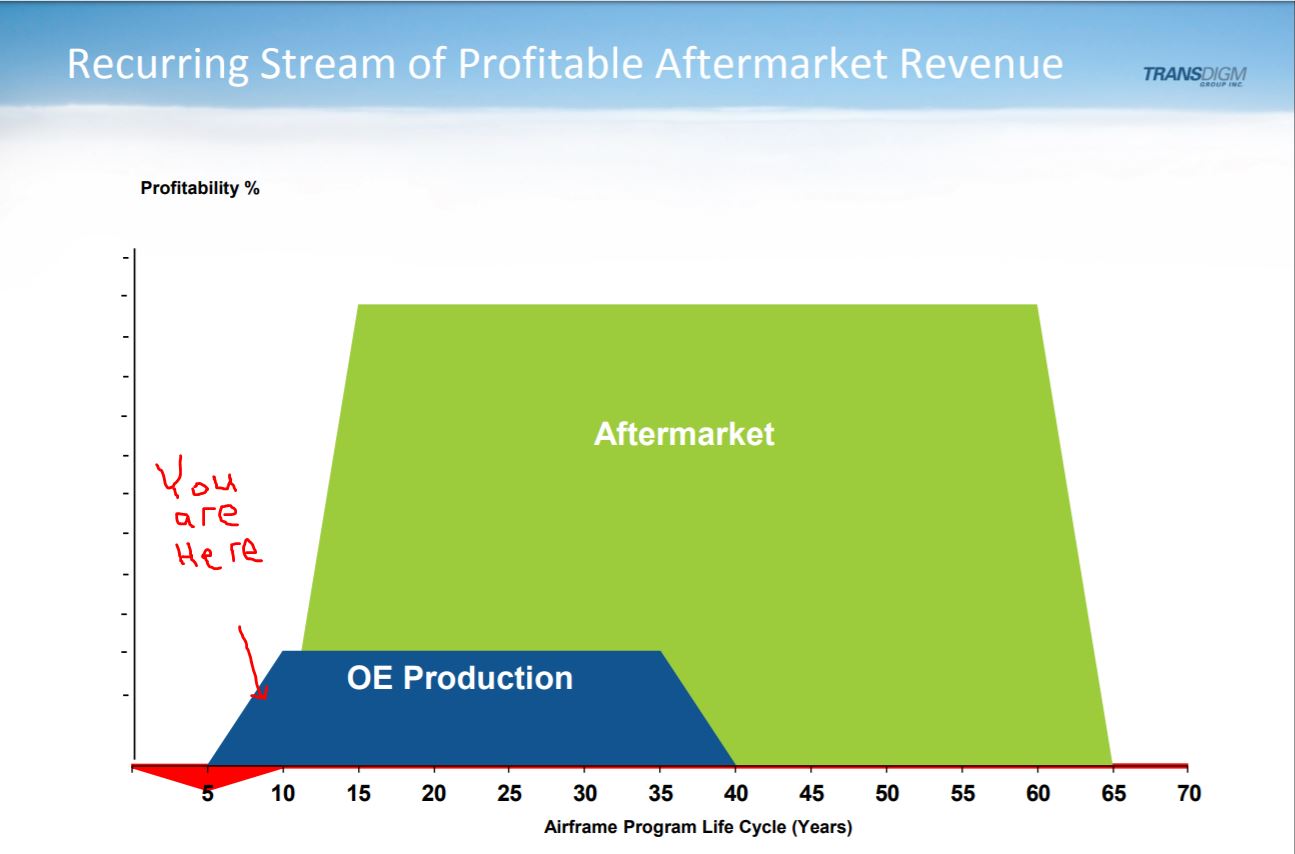
Based on PKE’s annual report and conference calls, they do have some revenue from selling spares or low volume toolings (not the same as spares but similarly high margin), but it is not yet a meaningful proportion of PKE’s revenue. As PKE matures within its various commercial and business jet programs, I think we can expect an increase in spares or aftermarket sales going forward.
Company Management
I’m not really sure how to show that the CEO is a bit different than your average CEO other than to provide a few examples. Like other companies I have written about on this blog, he comes across as honest and fair both within his communications with shareholders and based on how the company has allocated profits over the years.
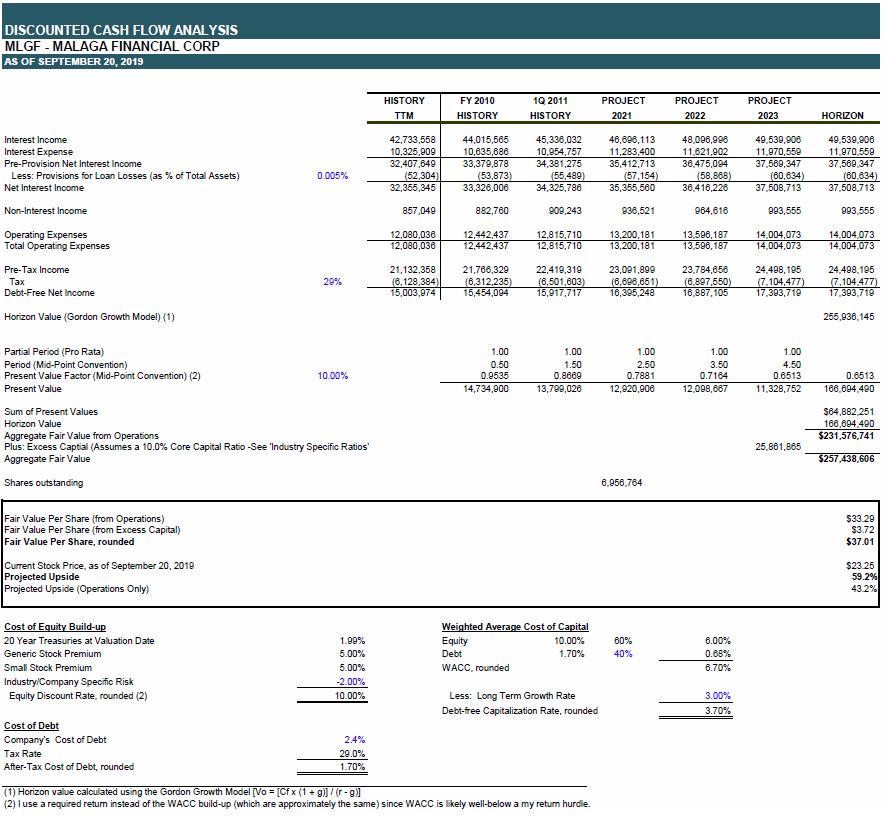
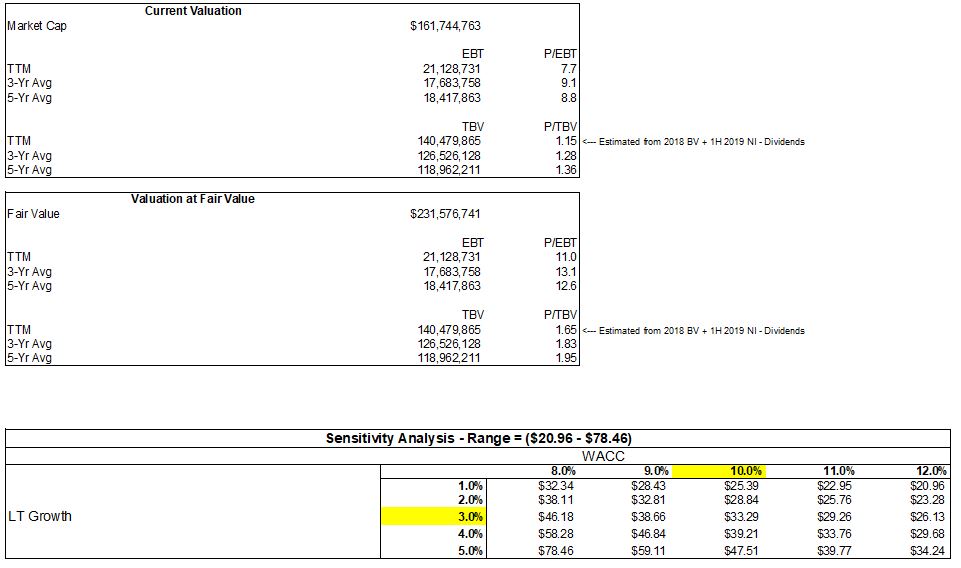
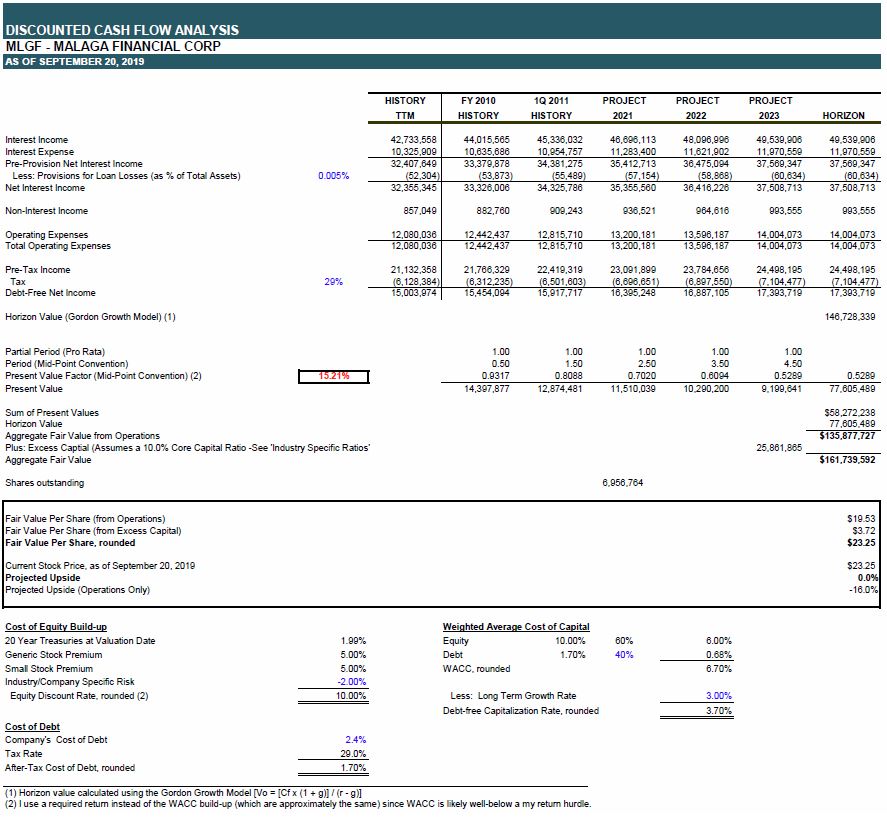
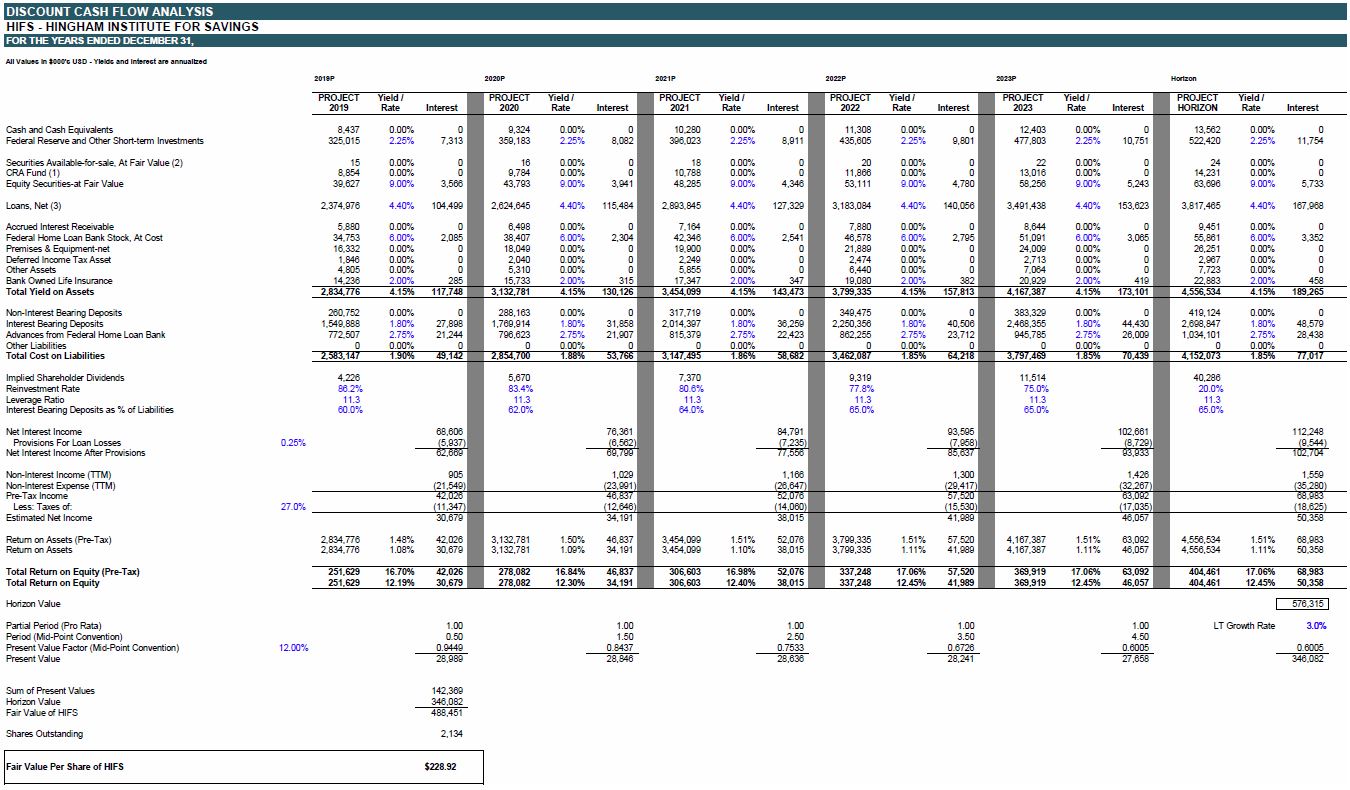
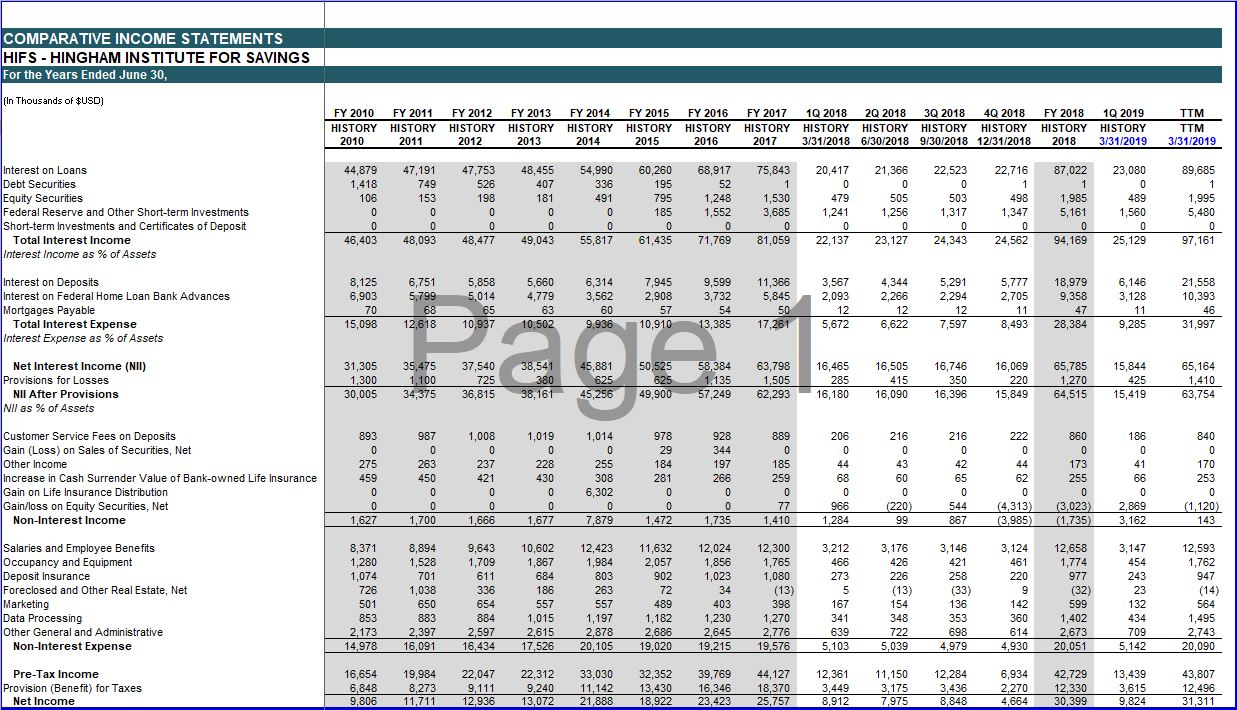
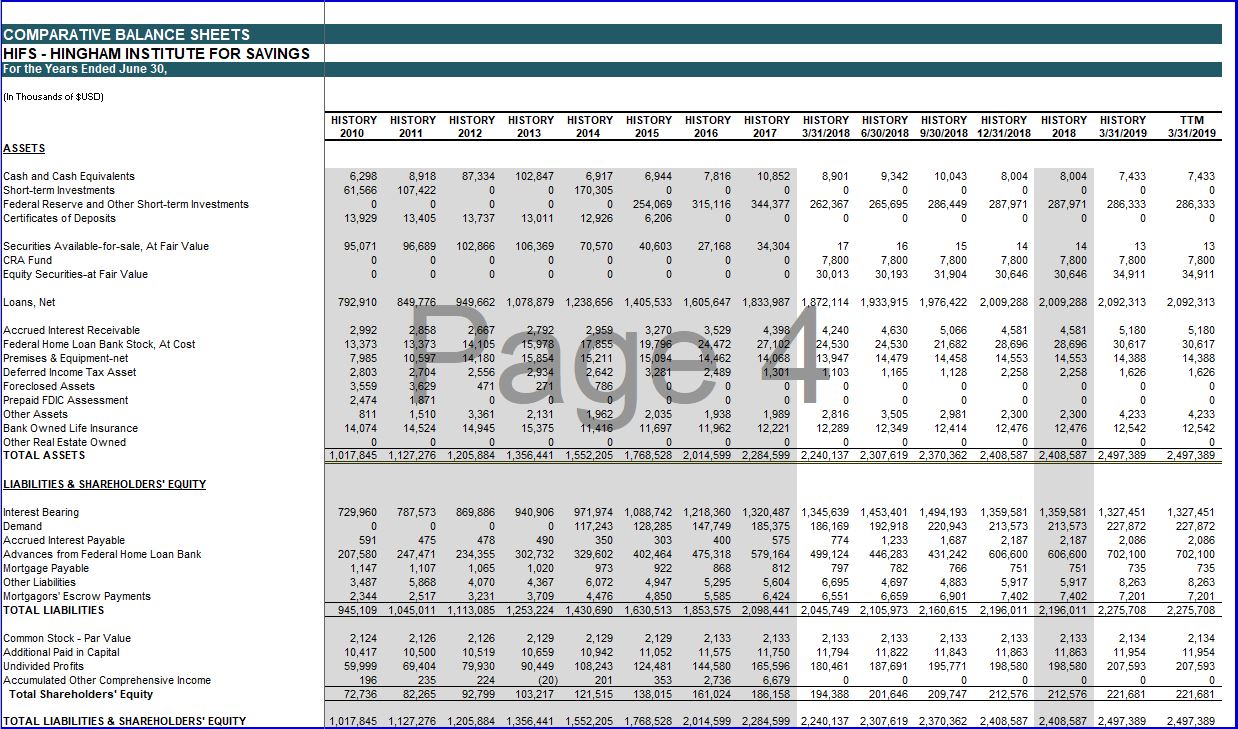
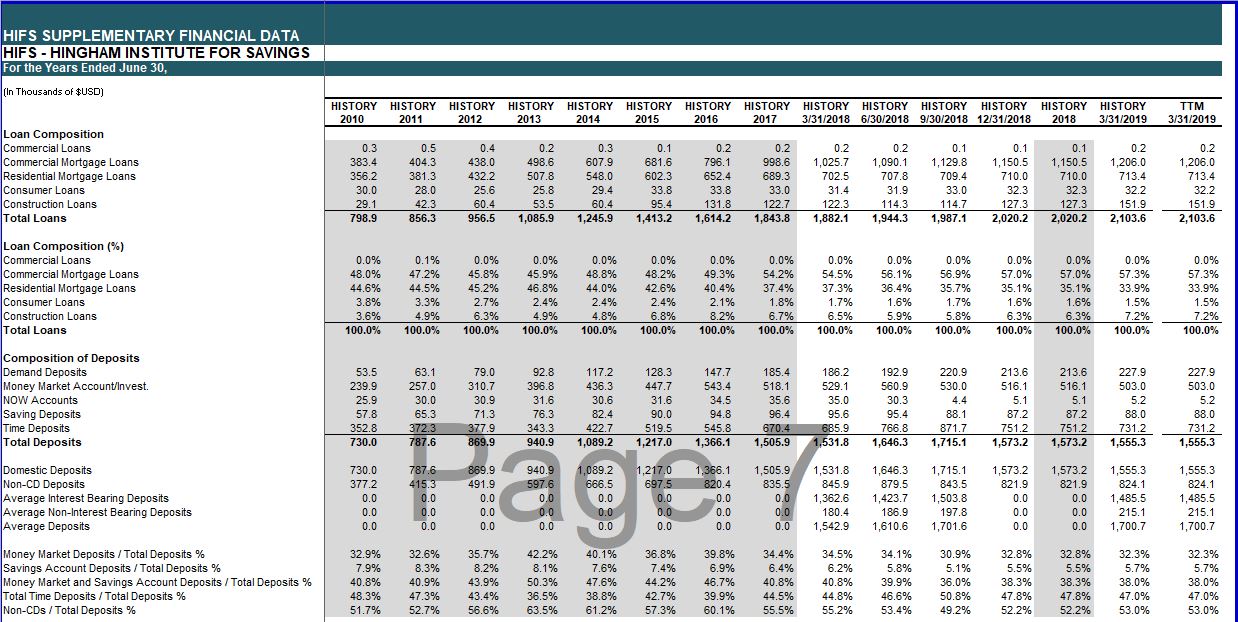
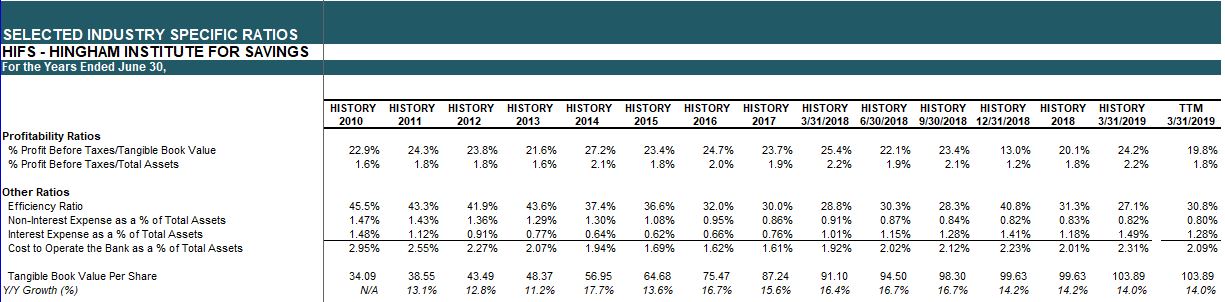
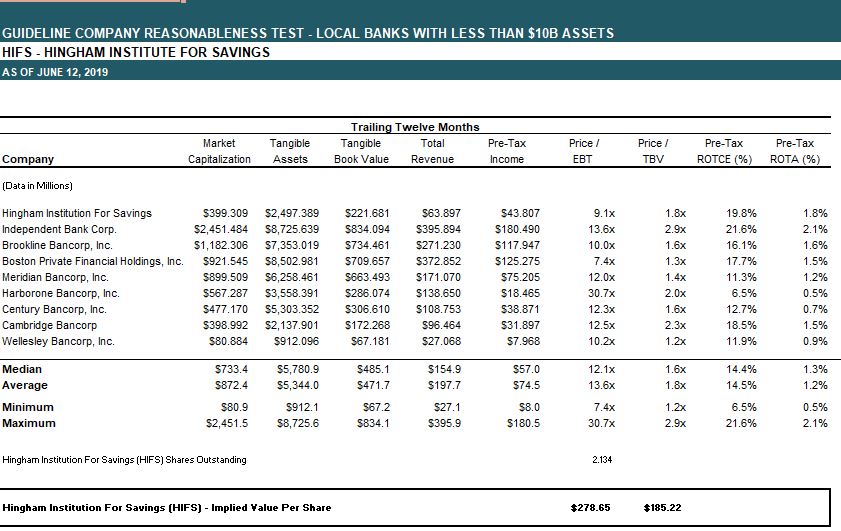
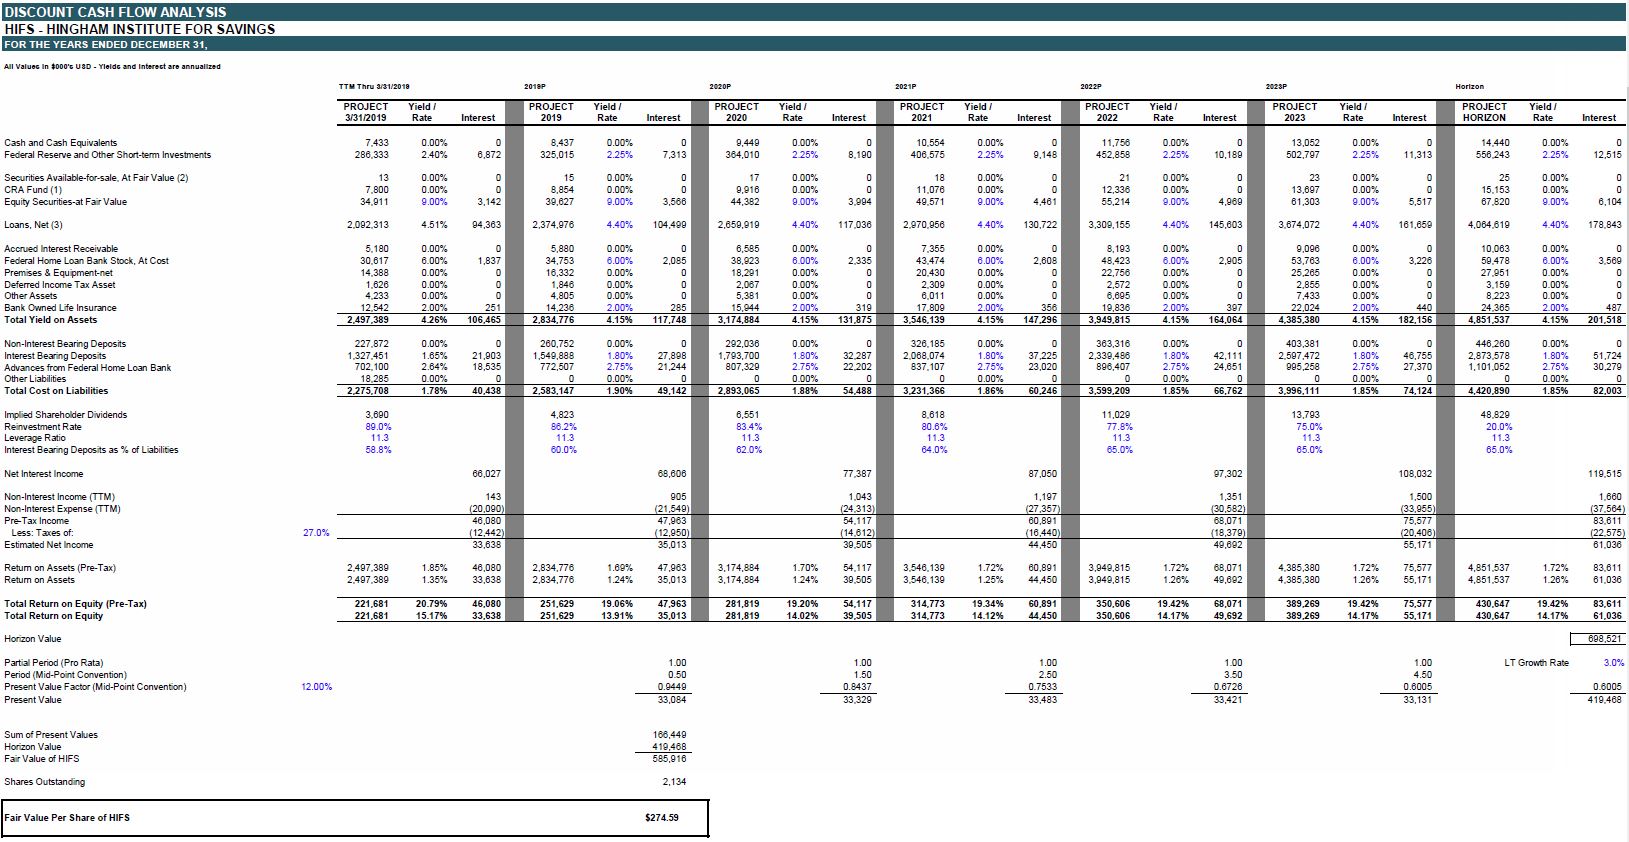
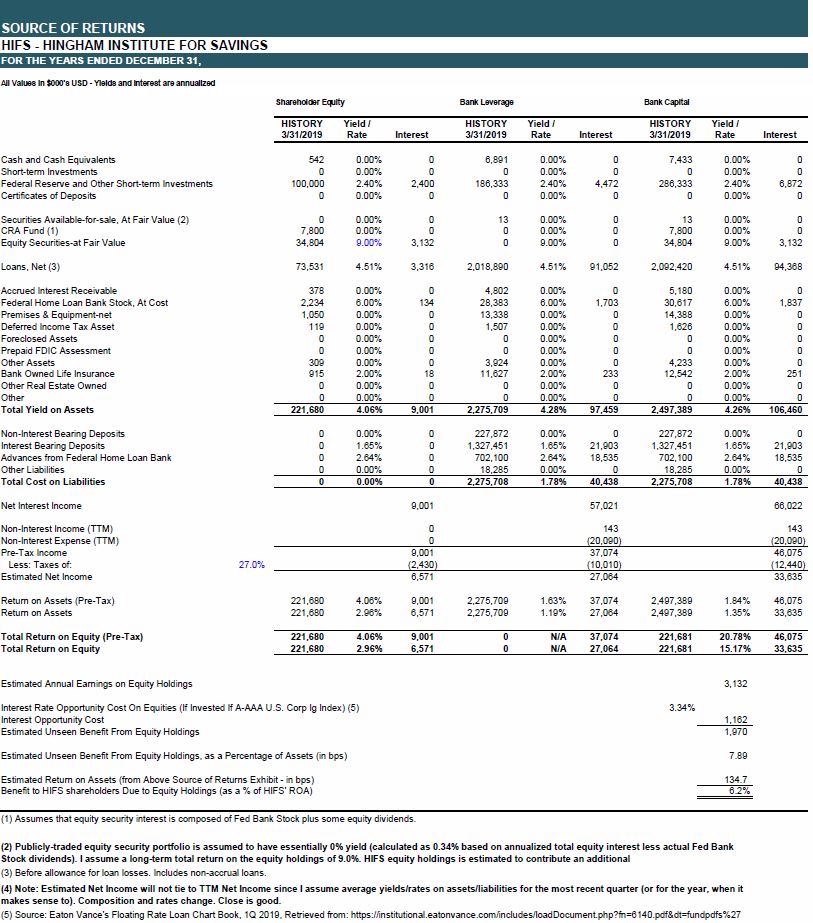
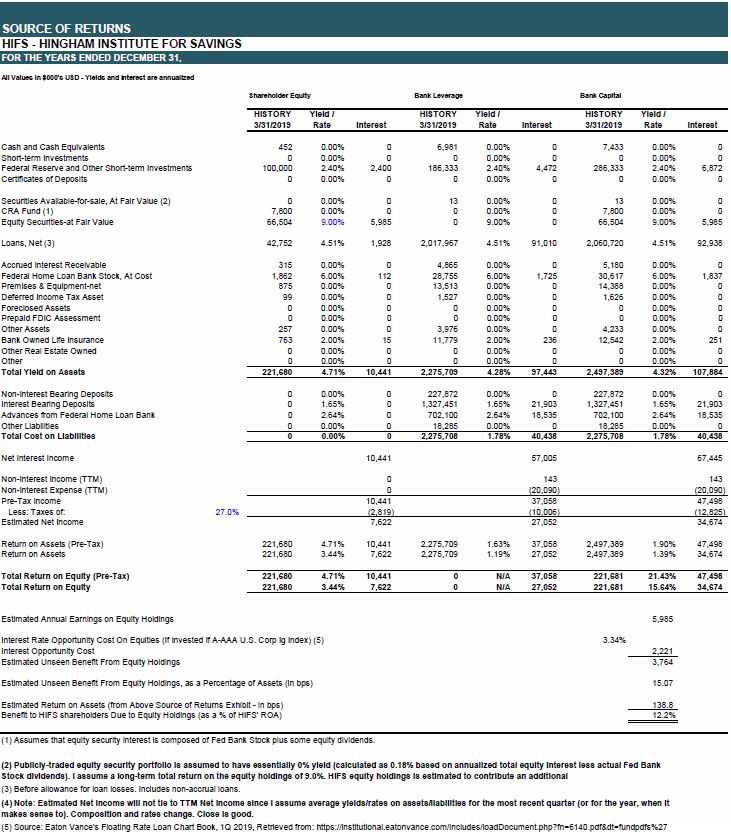
When writing about HIFS I mentioned that the first year that the Gaughen family had controlled of the bank, there was a huge increase in employee name and pictures in the annual report. It was little examples that showed up over years and years that seemed to indicate that there was something different about how the bank operated. In 2020, HIFS answered probing questions, in detail, and without any reluctance. It’s rare to find operators where the passion and care for the company and shareholders is as visible. I think PKE has many of those attributes.
While many companies have avoided addressing business conditions and withdrawing guidance, PKE faced the issue head-on to keep expectations inline with reality. In the 4Q 2020 conference call, PKE provided some potential outcomes for the GE engine program revenue going forward (see slide 15 of the 4Q 2020 call). It’s pretty cool that the CEO is upfront about a 50% and 85% decline in revenue over the next two quarters for their largest program.
So, let’s see. Thoughts about GE Aviation program revenues for fiscal 2021. We’ll give you a little bit of information here, but we’re kind of guessing just remember that perspective. Last year, we had about $29 million of GE Aviation program revenue, which if you divide by four, that’s an average of about $7.25 million per quarter. $7.25 million per quarter right just doing the math. That’s for perspective.
Q1, this is kind of a transition quarter, but unfortunately transition all the way down, probably $3.5 million, $4 million something like that. This is GE Aviation program revenue. Q2, it could be $1 million. And what’s the reason? Because all that burn down stuff is coming through, and all that inventory that’s caught throughout the supply chain, is getting absorbed.
This estimate will ultimately be used to help guide my rough 2020 and 2021 projections in the valuation.
In last year’s 4Q 2019 conference call, analysts asked about PKE’s M&A strategy, since it was still sitting on cash from the circuit board sale. The CEO described the company’s M&A strategy as follows:
Thank you, Matt. So good summary. So going through acquisition philosophy, as Matt said, we have about — after we take care of these items, we’ll have about $115 million of cash left. Even though we’ve paid $507 million of cash dividends since ’05, that long-term debt, we still have some cash available.
But we have a pretty active acquisition program, if you will, but our strategy is a little bit different. I think we call it, hit them where they ain’t. We participate in some of these auctions and we think they’re just not usually for us. Why? Because first of all, the prices are — value seems to get bit up and we’re not going to overpay for something and just — we’re looking long-term, we’re not looking to make a splash for two years, and then somebody else’s problem when somebody retires or something like that.
We have to buy — our objective is to buy something that will meaningfully contribute to Park’s value over the long period and it needs to be something unique, something different maybe, something nichey. One of the things we’ve done is we worked quite a bit with a couple of OEM customers that have been very helpful to us in terms of pointing us in the right direction. These are aerospace companies. In other words, let’s say, they like us, maybe love us, but they have other things they buy for the programs which made them not so happy about other products they buy, maybe they’re not so happy with the supply chain in that area.
So they pointed us in those directions. We’ve even found some overlap where — like two OEMs will point to certain areas within our own [Inaudible], maybe something is going on there. Not only they’ve given us the products, they’ve also given us names and, in some cases, many introductions for us. So we’ve made contacts.
Now these companies are not being auctioned or not for sale. So often the response is, what, we’re not for sale. But that’s the process. It’s a longer process.
It will take a little while — longer to get through it but we’ll end up with something better. And how does you plant the seed. You contact somebody, well, are you interested in talking? Well, no, as they don’t only know you. But you plant the seed, maybe have some follow-up discussions, and maybe at some point, he turns and say, well, maybe, we’d be interested in doing something with you.
So it’s very helpful. It’s — I mean, working with the OEMs is very good. We’re looking for things in aerospace. But again, some things which are unique and different and niche-y.
It’s not — the things that are auctioned, and I know their price is high but it’s kind of very standard stuff. Why is that? Because the people who like to bid on these things aren’t going to understand unique or niche-y technologies. They’re going to shy away from it because as I will get this stuff, right, so I’m not going to spend money on something I don’t know yet. So we end up competing with people that don’t really have deep understanding sometimes and after niches and then prices go up not for us.
Little stuff. They are doing all the right things. On the 4Q 2020 call (most recent quarter), Brian Shore addressed the topic once more.
We’ve been looking as we keep telling you for the last couple of years at acquisitions. And we’ve also said it’s very frustrating because the valuations don’t make any sense to us. I mean, we looked at companies where they were sold for six times revenue, six times revenue. And it’s like what, I’m kind of old school, how can that be? And these didn’t have the cure for cancer. They maybe thought they had a cure for cancer, but we didn’t think they had a cure for cancer. So the valuations just got to be wacky out there. But it’s a pattern. Every time we looked at something, the valuations were just way ,way — no I’m not talking about 10%, 15%, 20% higher than we thought. I’m talking about three, four, five times higher than we thought was appropriate.
And we kept getting told by bankers and such that “Look you really got to get in the game. You got to spend your money because you’re missing out.” Well we had discipline and we did the right thing. We took care of our shareholders’ money and we didn’t waste it and throw it away because we got emotionally involved or excited.
At the Needham Conference in January 2020, Brian Shore describes PKE’s history in the following way. There’s nothing special about it but the way the history is described seems to fit a pattern. It’s the little stuff when it comes to trusting people with your money.
In 2014, the Company’s former circuit board unit was experiencing declining revenue for the 4th straight year. PKE’s workers were getting less than a full week’s worth of hours so the CEO took a 20% paycut in solidarity with those employees.
I took a pay cut recently because electronics in the U.S. has been very weak since July,” he said in a phone interview Wednesday. “As a result, our people in Arizona and California are not getting full work weeks. I felt as a matter of solidarity that I should be in the same boat.
This is the best way I could think of to explain why the CEO is likely to be a good steward of shareholder capital.
Investment Thesis Recap
To tie the above background on the company and management in with the investment thesis, we can see:
- The multiple years of work the company has put in to build relationships with OEMs and private businesses in a now-distressed industry to have a better chance of acquiring a niche, value-accretive company
- The company has been both communicated and followed through on its careful approach to allocating capital appropriately
- CEO is a straight-shooter
- The potential for a great acquisition less available to others
If you are still reading at this point, I know what you’re thinking. Get to the valuation already, Moats! One more thing.
Guidance, as of January 2020, now withdrawn
One final thing worth introducing early is that as recently as February 2020, the company was experiencing extreme demand conditions and they were struggling to keep up with orders.
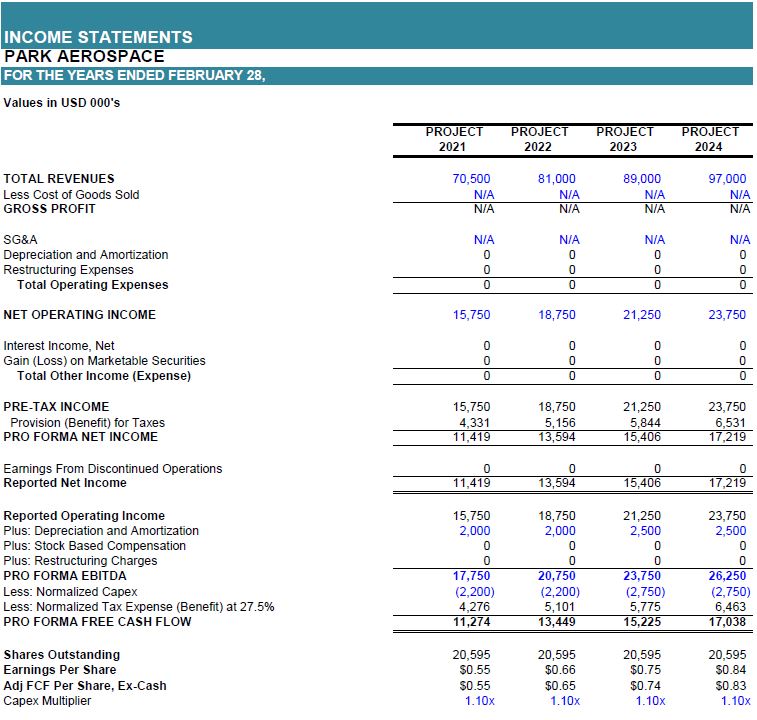
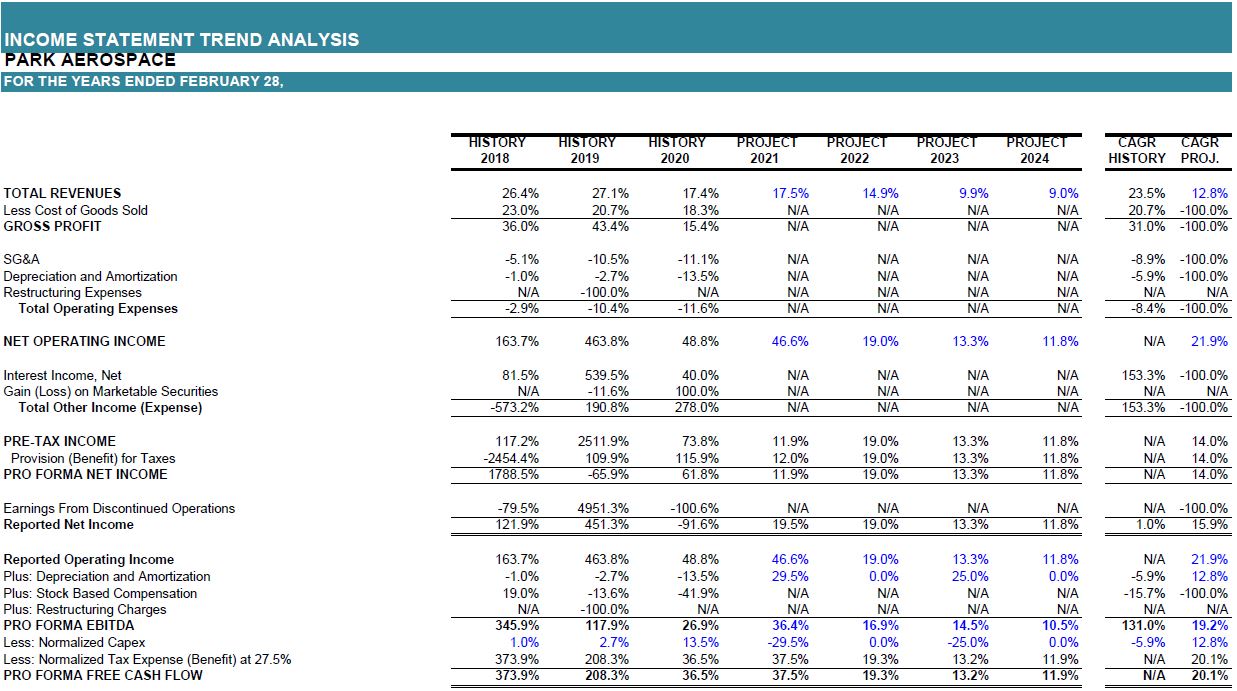
At that time, the company had a revenue CAGR of 23.5% over the prior 3 years and was projecting revenue and FCF growth of 12.8% and 20.1%, respectively. I point this out for comparison to my projections in the valuation to provide context. I think I’m being conservative in my valuation and likely underestimating value.
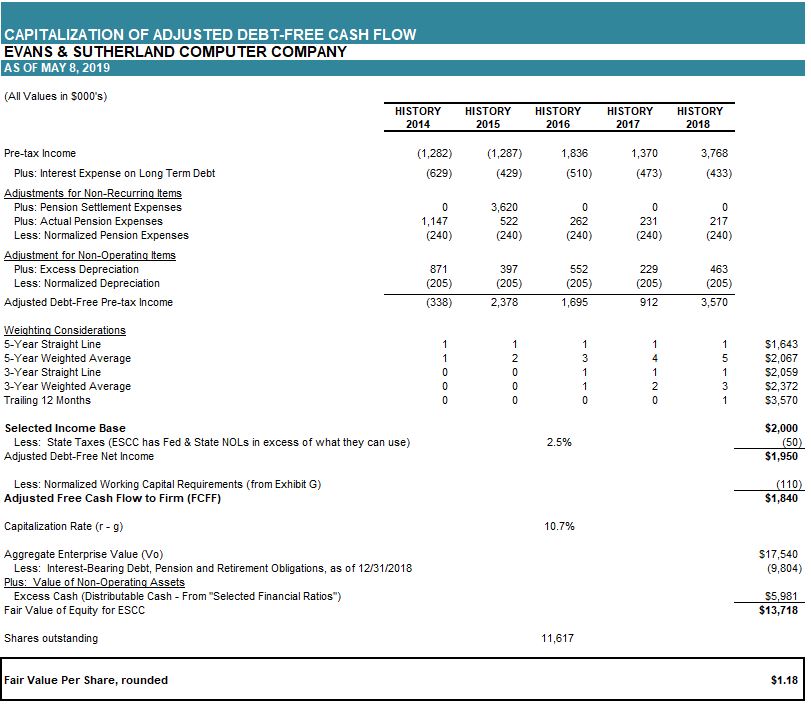
Valuation
This is one of the trickier valuations since we a missing a few key data points and I haven’t spoken to management, combined with the obvious issues with the aerospace industry. I’m sure I’ll have to do an update post at some point so hopefully this post lays enough groundwork that updates will be short.
Valuation Considerations:
One obvious thing we are missing is segment data for PKE’s aerospace segment. Previously, the company reported two operating segments. Without circuit boards, they have one segment. Hopefully the company will add granularity going forward to improve the ability to forecast cash flows. Today, all I have is hope, so not much I can do other than high-level revenue estimates proportionally applied across the cost structure of the company.
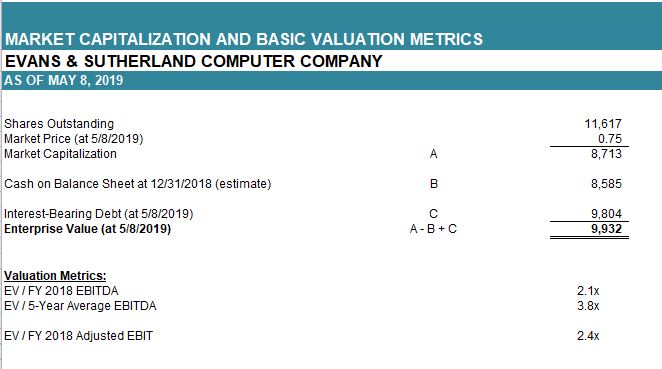
My first thought is that using historic data is probably reasonable, but similar to the ESCC post, I’ll have to consider a near-term lull in earnings. How deep of a decline and how long will the decline persist are critical questions. I’ll show my assumptions and you can make your own adjustments from there.
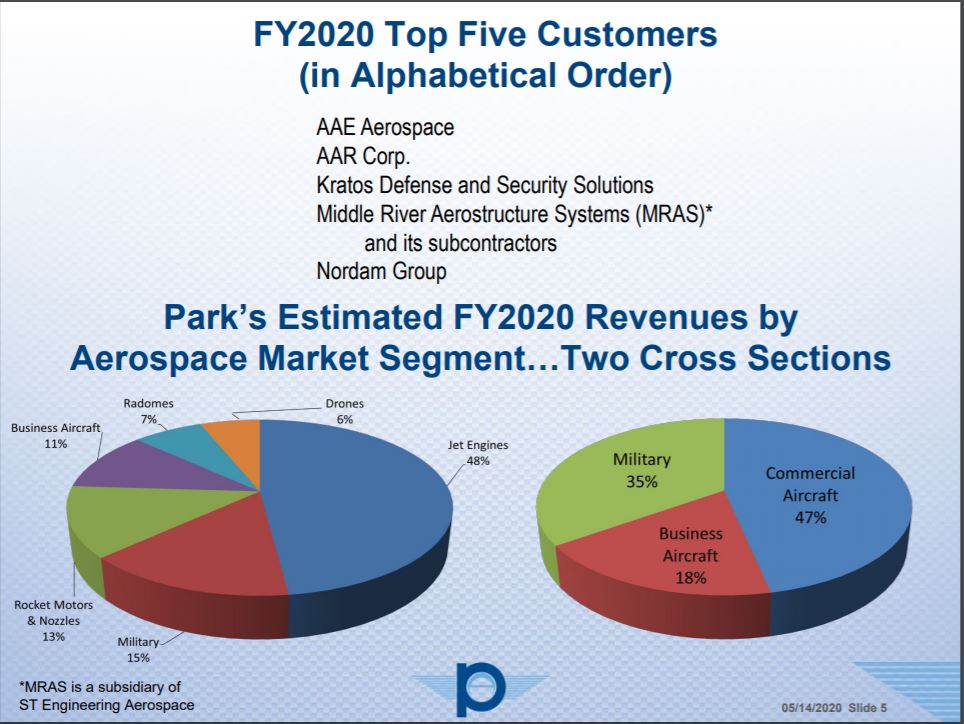
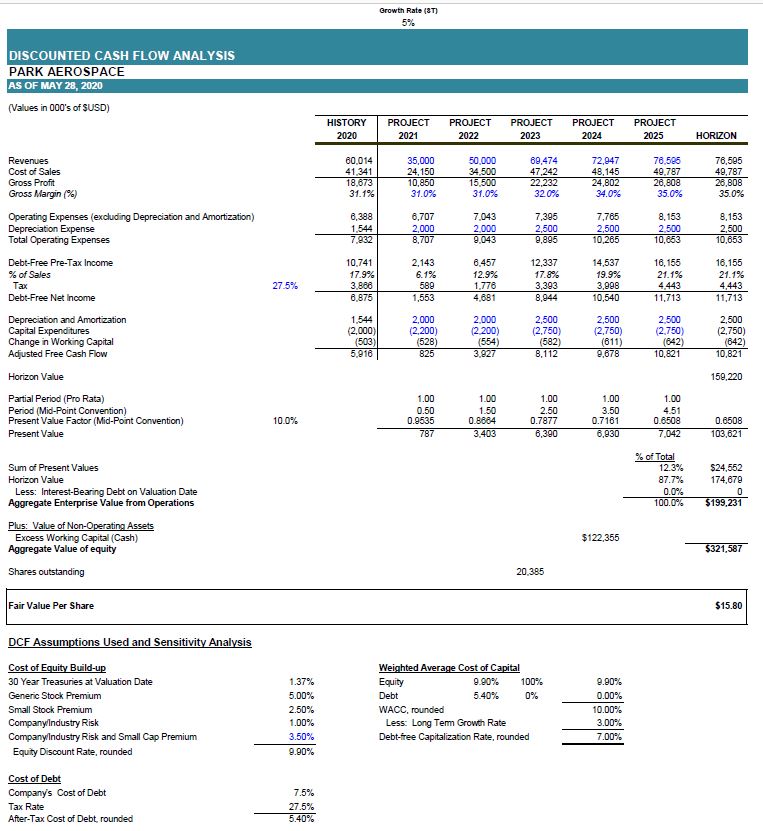
To determine the near-term decline, I looked to PKE’s public statements. The company’s military revenue hasn’t been affected, thus far. Further, I previously highlighted that commercial (and likely business) revenues may be down 50% with at least one quarter that could be much worse. In FY2020, PKE’s military revenue was approximately $21m. Commercial and business revenue were an aggregate $39m in FY2020. If we assume revenue is down roughly 65%, we get to a ballpark estimate of $35m in revenue for FY2021. This is a 50% decline from the company’s projected FY2021 revenue guided for in January 2020 (now withdrawn).
For FY2022 projections, all I knew is I wanted to low-ball it with the thought that if all of my inputs and assumptions are conservative and the concluded value is still higher than the market price, it will be a no-brainer to take a sizable position in the company (NOTE: As always, not your advisor, and no-brainer for me may not mean anything to you). I went with $50m which assumes roughly mid-single digit (MSD) growth for military and roughly splitting the baby for commercial and business to represent a recovery but not a full comeback.
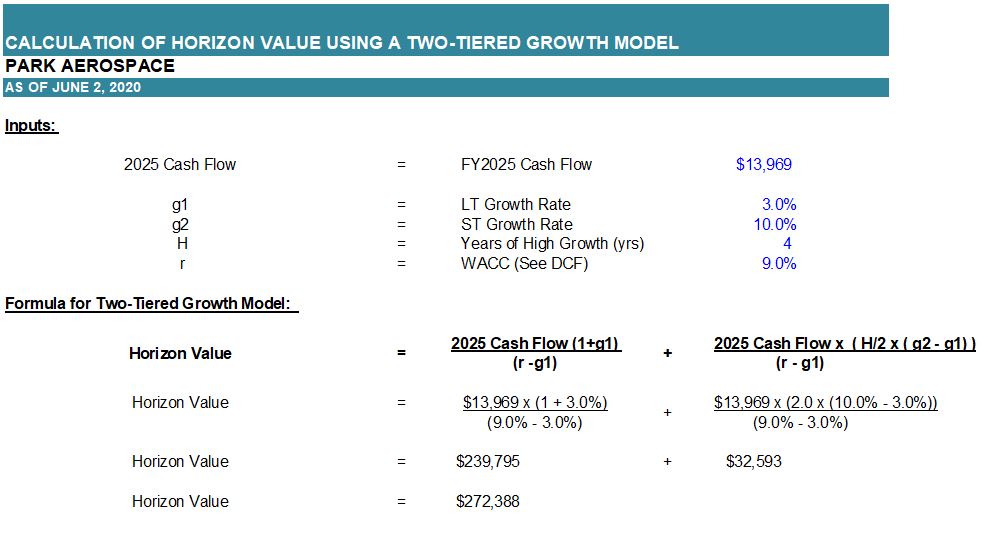
From FY2023 through FY2025, I assume PKE grew by the ST growth rate (5%, see the top of the DCF) from FY2020. This and the two-tier growth model are where I think I’m adding some conservatism in my estimates rather than simply assuming an immediate return to projections made in January 2020 as some might. In all these assumptions, we are implicitly underwriting for something akin to Warren Buffett’s bearish tone on the aerospace industry.
In summary, in the base DCF, I assume something close to -50% and -17% revenue decline, relative to FY2020, followed by four years of 5% growth and four years of 8% growth. At that point, the the LT growth rate of 3% is assumed from that now-normalized earnings base.
DCF (Base Case):
Other Inputs:
- The WACC is assumed to be 10%. I spelled it out to show you the most probable mode to higher valuation multiples (multiple expansion) going forward. Simply pricing PKE on a market WACC, as opposed to an all-equity distressed WACC, will increase value. If PKE’s qualitative thesis plays out, this may occur (we are a long way from this, but that’s the LT homerun upside).
- The CEO once said he hopes to never lay-off anyone. I trust him in that regard and assuming growing G&A, despite declines in recent years and the current environment.
- Depreciation is based on the January 2020 projections.
- The gross margin expansion is based on the January 2020 projections in that it indicates improving product mix, which is likely still true today.
PKE previously estimated FCF of $17m in FY2024. I project FCF of $10.8m in FY2025. I think we have a buffer built in here.
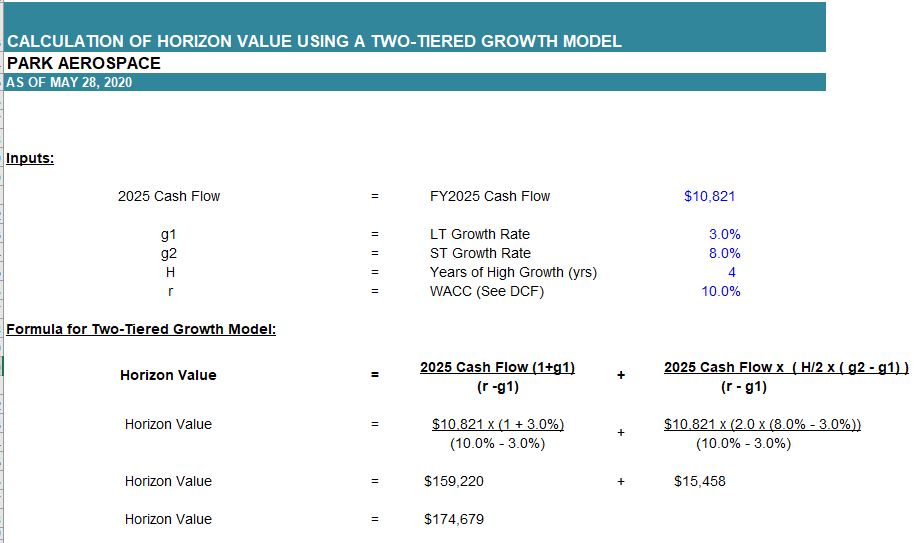
DCF (base post-CV)
If you read my twitter, the first thing that jumps out is I showed a value of $12.95 and now it’s $15.80. What gives?
Previously I only assumed four years of 5% growth before LT growth of 3.5%. That seemed overly pessimistic in relation to PKE’s prospects a few months ago and their relative prospects within the industry. Odds are, the aerospace market returns to growth at some point in the next 5 years.
Here is the horizon value and where the excess cash comes from:
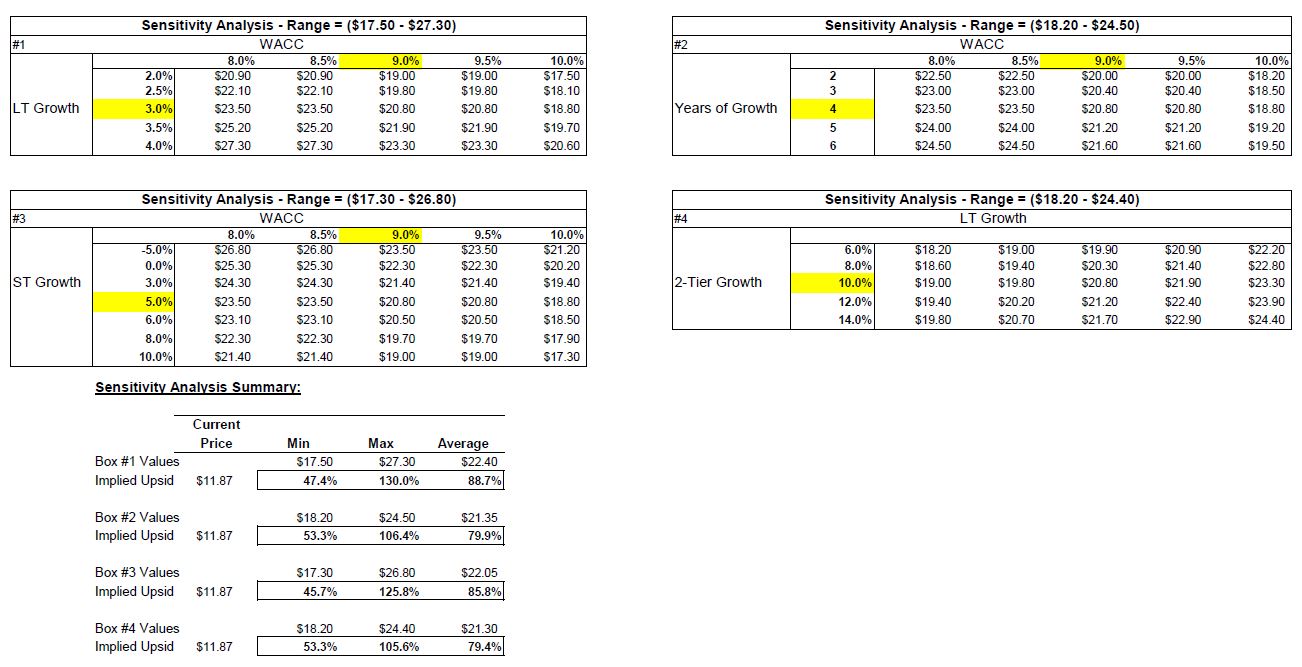
Sensitivity Analysis
One thing that is a recurring theme in this post is uncertainty with the industry. It’s worth showing many different slices of the above to give you an idea of the upside/downside characteristics of PKE at today’s price (closed at $11.87 on June 2, 2020).
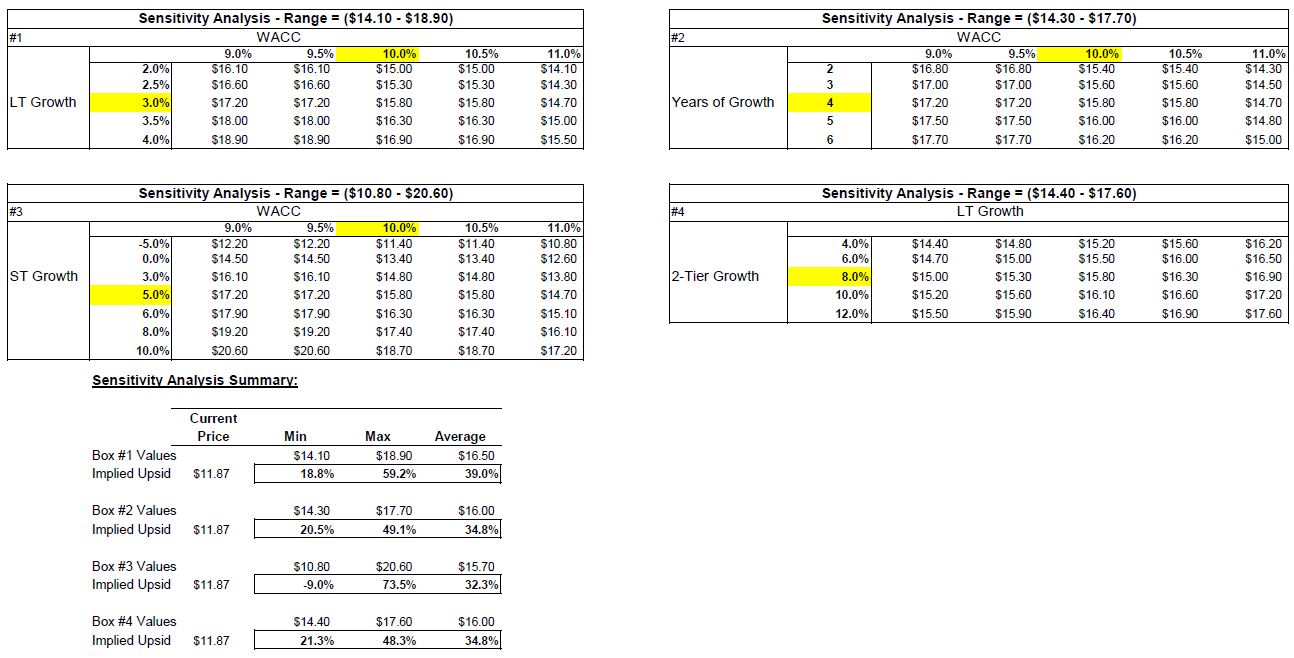
From here, the immediate response may be, “ok, so it’s a good company at a fair price, but there’s not much upside.” Not so fast, my friend. As I mentioned, we built in conservatism all over. The WACC is too high, the discrete 5-year projection period assumes a long and slow aerospace recovery period, with minimal upside in years 6 through 9.
What does the upside look like? Let’s pull those levers!
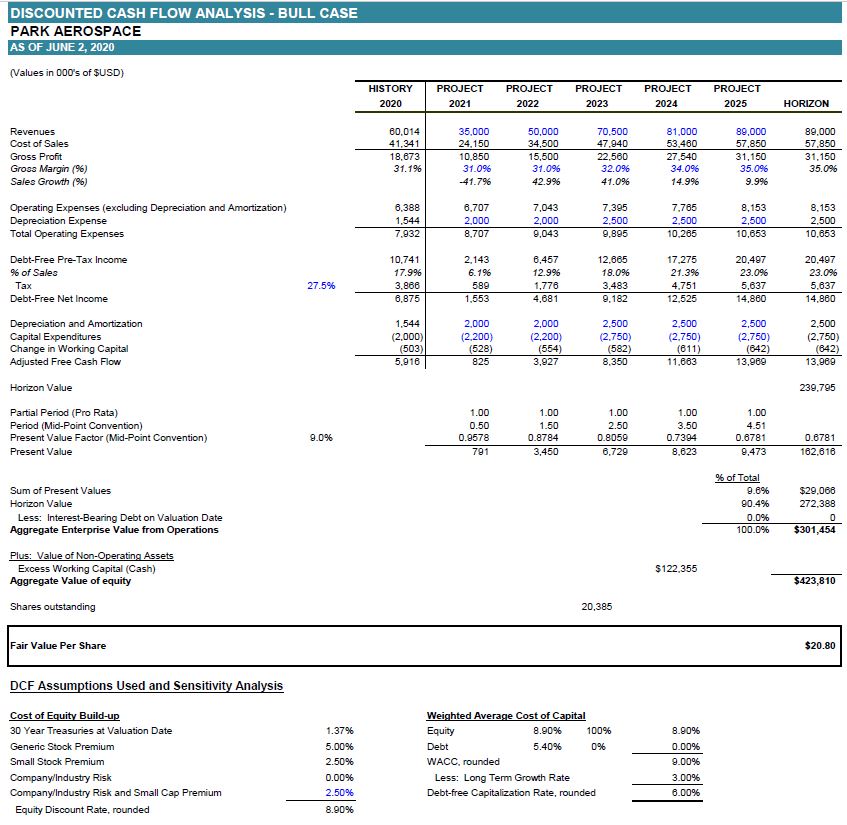
DCF Valuation – Bull Case
New Assumptions/Inputs:
WACC: 10% – 9% (to reflect recovery and earnings growth)
Revenue: FY2023 – FY2025 uses the projected revenue for FY2021-FY2023 the company provided in January 2020 (this assumes the company’s future was delayed by two years).
2-Tier model: Growth continues at 10% (instead of 8%) for those additional 4 years
Bull Case Model:
Files:
DCF (bull post-CV)
sensitivity analysis (6.2.20 – bull)
Valuation Summary
In the bull case, you can start to see the relatively lower-risk, high upside potential. Further upside is still possible when you consider the Bull Case roughly concludes a 20x terminal FCF multiple, despite a growth rate of 10% at that time. It assumes none of the current cash balance is invested or reinvested, there is no M&A assumed, and there are no new products assumed that lead to stepped growth as opposed to the smoothed growth modeled.
Finally, one aspect unexplored is the desirability of the asset. PKE would obviously be an acquisition target if not for the CEO, who seems unlikely to sell. However, the CEO is in his late-60’s and a lot is possible in life. PKE shares many qualities with Breeze-Eastern (BZC), which was another microcap with sole source products, ultimately acquired by TDG. I consider this a very low possibility, but note it to make the point that this post still leaves a lot of avenues unexplored.
In general, I think PKE is one of those rare microcap opportunities that will probably do well and has a meaningful chance of being a multi-bagger or homerun.
Why Does This Opportunity Exist
Although I have mentioned the aerospace industry issues and the sale of the circuit board business, which caused PKE not to screen well for many years, there is likely one other factor causing PKE to sell at such a discount relative to peers (other than company size). Raging Capital has decided to close up shop in April 2020. At 12/31/2019, they owned 9.15% of the company. They sold 1/3rd of that stake in 1Q 2020 and likely continue to be relatively indiscriminate sellers. This has kept pressure on the stock price and provides a reasonable level of volume for similarly sized funds to take on a position. Among other reasons, I think PKE hasn’t seen a stock rebound similar to other aerospace peers due to the selling pressure that will abate soon.